
Content intended for healthcare professionals. By continuing, you confirm you are a HCP.
Bone microarchitecture
Bone microarchitecture, the internal architecture of trabecular bone, is determined by how its struts are arranged and connected. This is a determinant of fracture resistance that density alone cannot see.
The biology
Inside the vertebrae and the ends of long bones lies trabecular (or cancellous) bone: A three-dimensional honeycomb of thin bony struts called trabeculae. This lattice bears load, absorbs impact, and remodels continuously throughout life.
Its strength comes not only from how much bone tissue is present, but from how that tissue is organised: The thickness of the struts, how densely they're spaced, and, critically, how well they're connected to one another. A well-connected lattice distributes load across many struts. A degraded one concentrates stress on the few that remain.
This structural dimension is what clinicians mean by bone quality, as distinct from bone quantity (mass or density). Two people can carry the same amount of bone mineral yet have very different architecture — and therefore very different fracture risk.
Same density, different structure
Both models below contain the same amount of bone. But the arrangement — the connectivity — is what determines strength.

Model A · High TBS
Dense, well-connected
Load is spread across a richly connected lattice. Many struts share the stress and the structure is resilient.
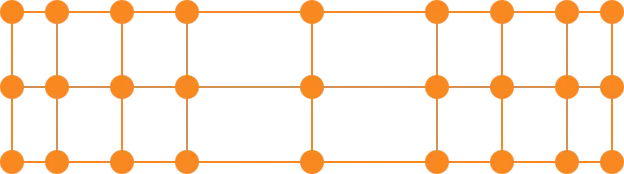
Model B · Low TBS
Thinned, disconnected
The same nodes remain, but struts have thinned and broken. Stress concentrates on the few links left and the structure is fragile.
Both models share the same bone mineral density. On a DXA report they could read identically, yet Model B carries far higher fracture risk. That difference is what TBS® makes measurable.
The vocabulary
How struts join up
Connectivity
A network with many cross-links redistributes load when any single strut is stressed. Loss of connectivity is an early, load-bearing failure.
How many struts
Trabecular number
More trabeculae, more densely spaced, mean more load paths through the bone and greater tolerance to local damage.
The gaps between
Trabecular separation
As struts are resorbed, the spaces widen. Wider gaps signal a sparser, weaker lattice — even at unchanged density.
Why density misses it
Bone mineral density is a two-dimensional average of mineral content. Two very different lattices can average to the same number, which is why up to half of fragility fractures occur in people whose BMD is not in the osteoporotic range. The missing information is structural.
From pixels to structure
Trabecular Bone Score® analyses the grey-level texture of an existing lumbar-spine DXA image. A dense, well-connected lattice projects as fine, homogeneous variations; a degraded one projects as a coarser, patchier texture.
TBS® quantifies that texture into a single index: A structural companion to the BMD from the very same scan. No extra imaging, no extra dose.
1
Start from the routine lumbar-spine DXA already acquired for BMD
2
Analyse the pixel grey-level texture (the fine variations that reflect the underlying 3D lattice)
3
Compute the TBS index: Higher = dense, connected; Lower = degraded microarchitecture
4
Read it alongside BMD to assess fracture risk more completely.
We help clinicians reveal more from routine imaging — every patient, every scan — for better care.